fabric
Metrics
Observability is crucial when operating a SaaS system because it’s not possible to debug it live. Alongside structured logging and distributed tracing, metrics are one of the pillars of observability.
Microbus supports both push and pull models:
- To push metrics to an OpenTelemetry collector, set the
OTEL_EXPORTER_OTLP_METRICS_ENDPOINTorOTEL_EXPORTER_OTLP_ENDPOINTenvironment variable appropriately - Alternatively, set the
MICROBUS_PROMETHEUS_EXPORTERenvironment variable and configure Prometheus to scrape metrics from the metrics core microservice
Standard Metrics
By default, all microservices produce a standard set of metrics:
- The microservice’s uptime
- Histogram of the execution time of callbacks such as
OnStartup,OnShutdown, tickers, etc. - Histogram of the processing time of incoming requests
- Histogram of the size of the response to incoming requests
- Count of outgoing requests, along with the error and status code
- Histogram of time to receive an acknowledgement from a downstream microservice
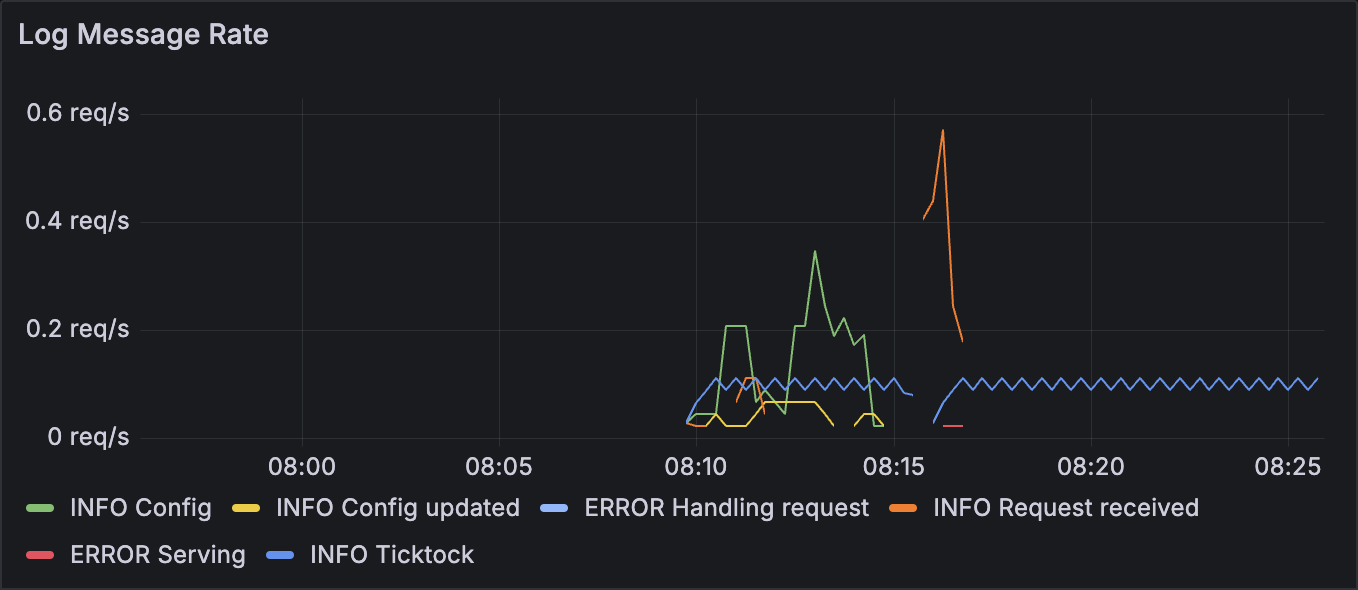
- Count of log messages recorded
- Count of distributed cache operations, including hit and miss stats
- Memory usage of the distributed cache
Custom Metrics
Custom metrics are defined using the Connector’s DescribeCounter, DescribeGauge or DescribeHistogram. Metrics are incremented or observed using IncrementCounter, RecordGauge or RecordHistogram, depending on their type.
The coding agent can assist in the definition of metrics.
Hey Claude, create a metric that counts the number of likes per post ID.
IncrementCounterLikes (or something similar) will be created by the coding agent in intermediate.go.
func (svc *Intermediate) IncrementCounterLikes(ctx context.Context, num int, postId string) error {
	// ...
}
It can then be used to count the number of likes from anywhere in the microservice’s code.
func (svc *Service) Like(ctx context.Context, postId string) error {
	// ...

	err := svc.IncrementCounterLikes(ctx, 1, postId)
	if err != nil {
		return errors.Trace(err)
	}
	return nil
}