fabric
Distributed Tracing
Distributed tracing enables the visualization of the flow of function calls across microservices and processes. Without distributed tracing, it’s extremely challenging to troubleshoot a distributed system. Microbus leverages OpenTelemetry to automatically create and collect tracing spans for executions of endpoints, tickers and callbacks of all microservices and visualize them as a single stack trace.
Configuration
Microbus exports tracing spans via the OTLP collector. The OTEL_EXPORTER_OTLP_TRACES_ENDPOINT or the OTEL_EXPORTER_OTLP_ENDPOINT environment variables may be used to configure the collector’s endpoint.
Whether or not a trace is exported to the collector depends on the deployment environment of the microservice:
- In
LOCAL,TESTINGandLABdeployments, all traces are exported to the collector - In
PRODdeployments, only traces that contain at least one error span, or those that are otherwise explicitly selected usingsvc.ForceTrace, are exported to the collector
Example
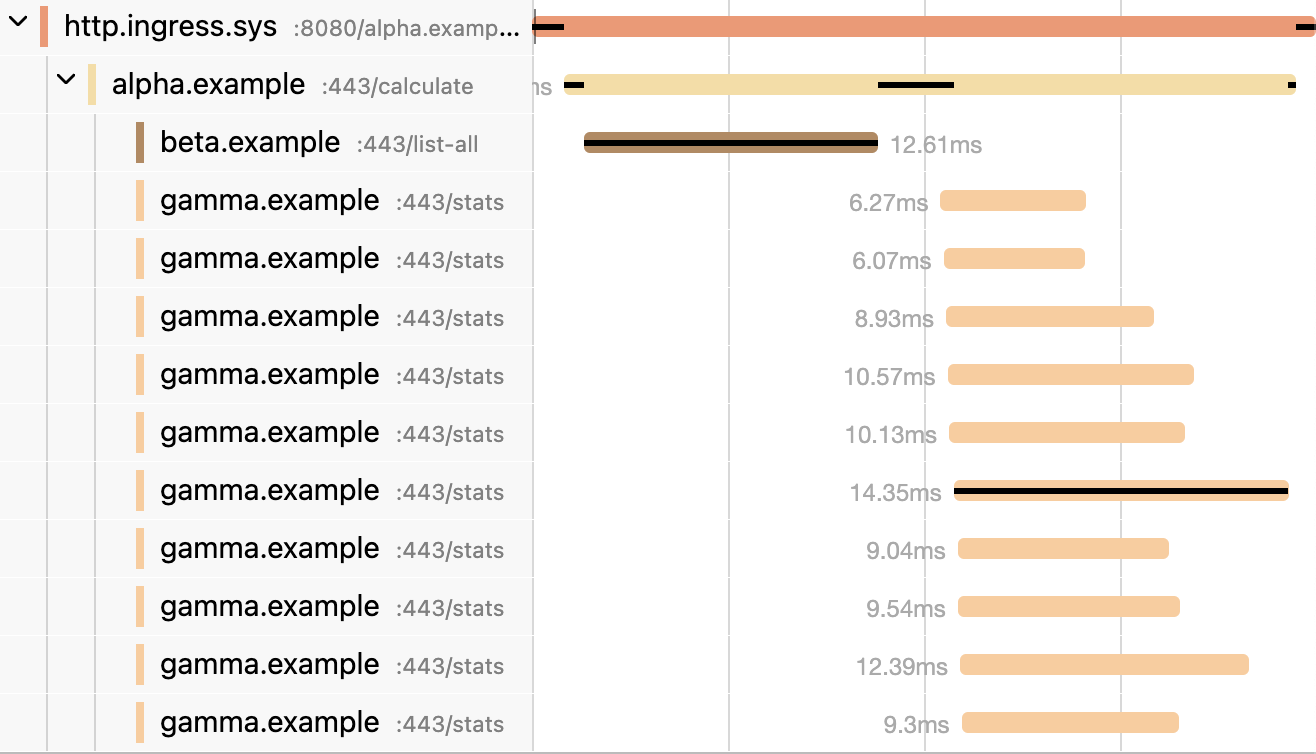
Here’s a visualization of a fictitious microservice alpha using the notorious N+1 anti-pattern. One can easily spot the serialized nature of the code. It took 104ms to complete.
func (svc *Service) Calculate(ctx context.Context) (sigma float64, err error) {
	keys, _ := betaapi.NewClient(svc).ListAll(ctx)
	var amounts []float64
	for k := range keys {
		stats, _ := gammaapi.NewClient(svc).Stats(ctx, keys[k])
		amounts = append(amounts, stats.Amount)
	}
	return svc.stdDeviation(amounts), nil
}
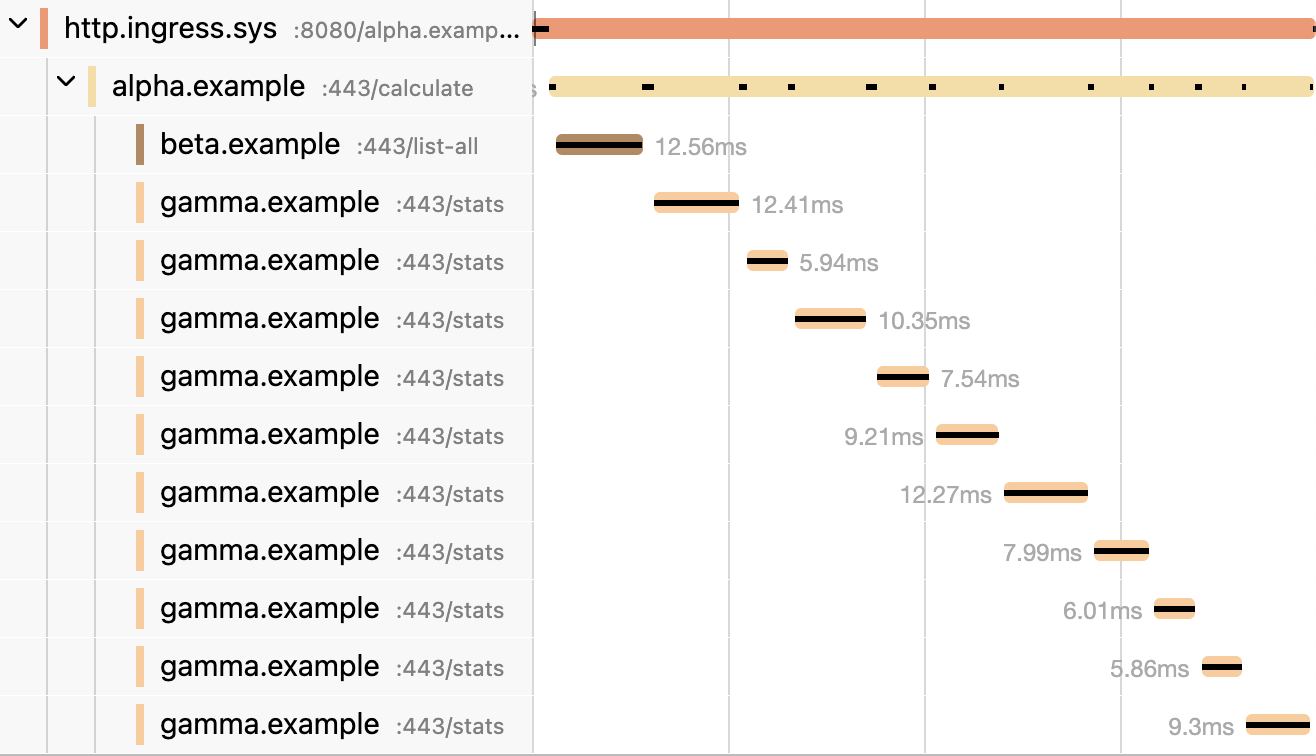
And here’s the same function rewritten to perform the N operations in parallel. It completed in 28ms, almost a 4x improvement.
func (svc *Service) Calculate(ctx context.Context) (sigma float64, err error) {
	keys, _ := betaapi.NewClient(svc).ListAll(ctx)
	amounts := make([]float64, len(keys))
	jobs := []func() error{}
	for k := range keys {
		k := k
		jobs = append(jobs, func() error {
			stats, _ := gammaapi.NewClient(svc).Stats(ctx, keys[k])
			amounts[k] = stats.Amount
			return nil
		})
	}
	_ = svc.Parallel(jobs...)
	return svc.stdDeviation(amounts), nil
}